如何自定义饼图的 label 文字内容、颜色、布局
问题描述
类似这样的饼图,label 的文字内容、颜色、布局可以按照自定义的需求调整吗?能够支持到什么粒度?应该怎么配置调整?
解决方案
不同图表库对饼图的支持力度不同,对饼图 label 标签支持力度也不同,在 VChart 中:
- label 的文字内容:可以通过
label.formatMethod回调函数设置自定义的标签内容,参考配置文档 - label 的文字颜色:可以通过
label.style设置文字的样式,包括颜色、字体、大小等等,只要是 VChart 文字图形支持的属性都可以配置,参考配置文档 - label 的布局:如果是想简单的调整标签的位置,可以通过
label.position设置标签的位置是在内部还是外部;如果想调整布局策略,可以通过label.layout进行详细的调整,具体可以参考配置文档
代码示例
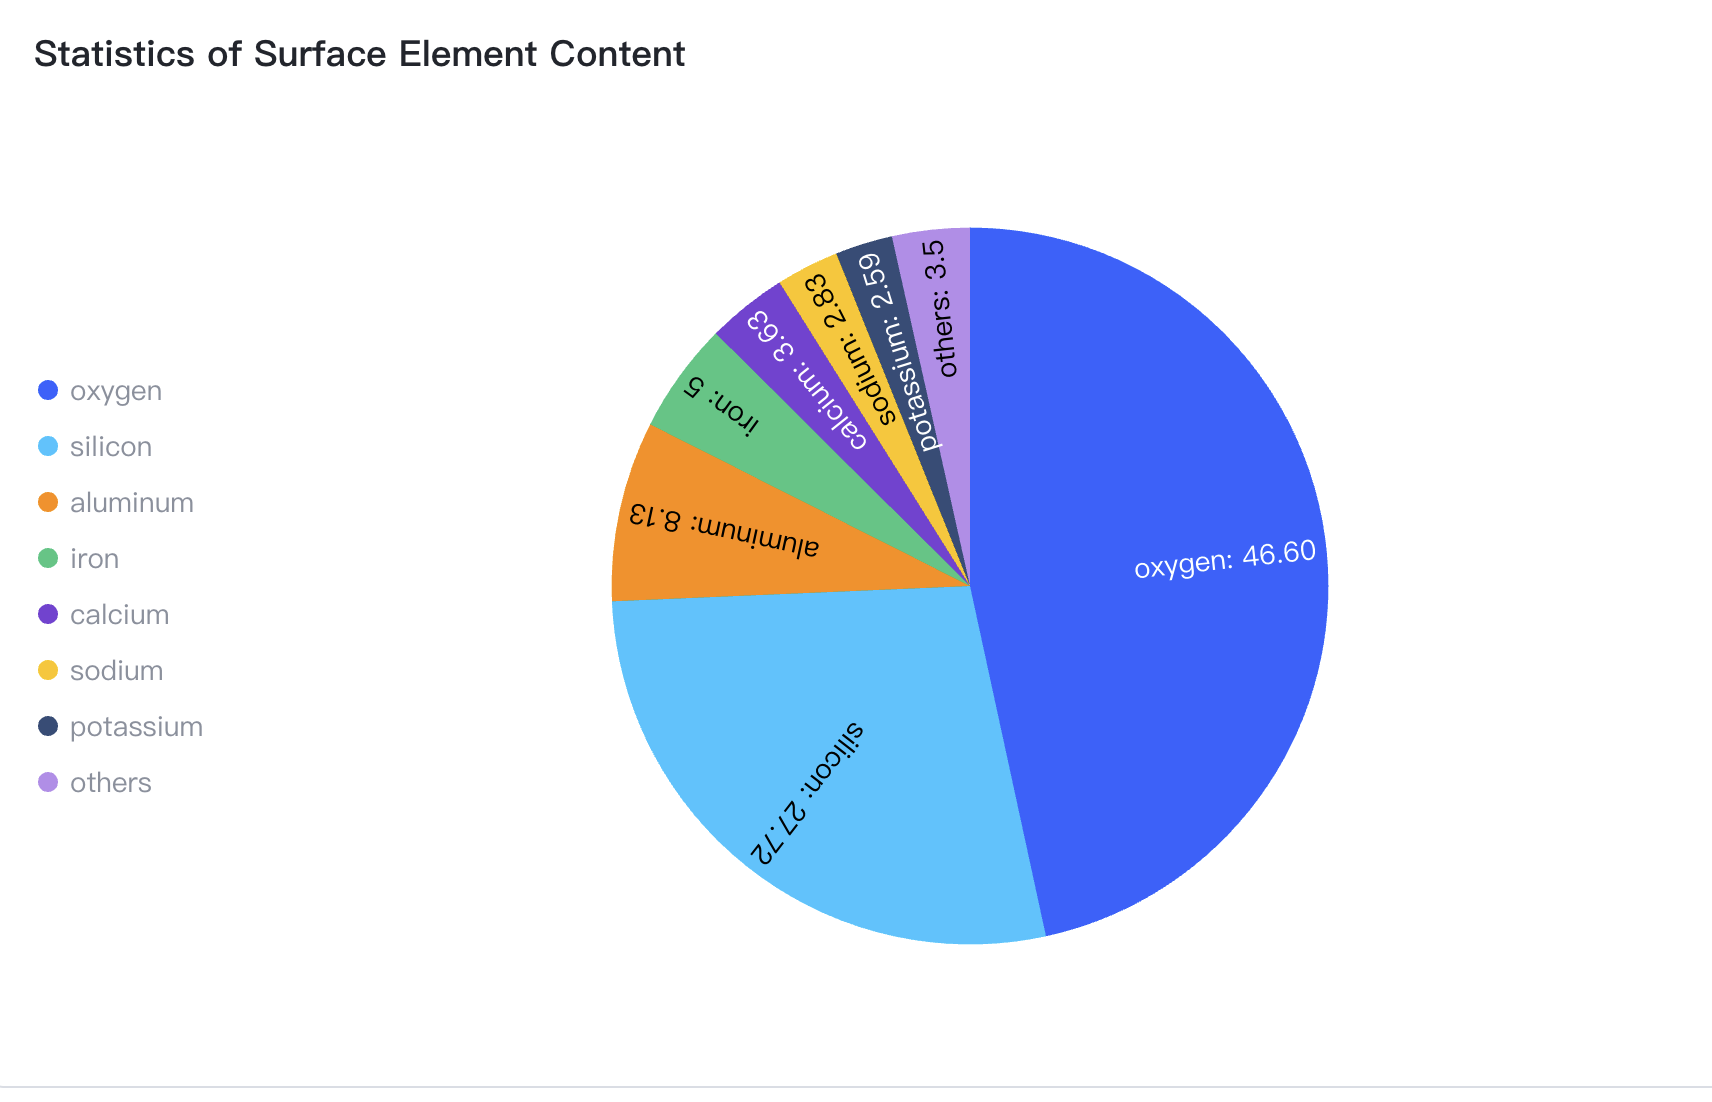
- 自定义文字内容和文字颜色
const spec = {
  type: 'pie',
  data: [
    {
      id: 'id0',
      values: [
        { type: 'oxygen', value: '46.60' },
        { type: 'silicon', value: '27.72' },
        { type: 'aluminum', value: '8.13' },
        { type: 'iron', value: '5' },
        { type: 'calcium', value: '3.63' },
        { type: 'sodium', value: '2.83' },
        { type: 'potassium', value: '2.59' },
        { type: 'others', value: '3.5' }
      ]
    }
  ],
  outerRadius: 0.8,
  valueField: 'value',
  categoryField: 'type',
  title: {
    visible: true,
    text: 'Statistics of Surface Element Content'
  },
  legends: {
    visible: true,
    orient: 'left'
  },
  scales: [{
    id: 'labelScale',
    type: 'linear',
    domain: [{
      dataId: 'id0',
      fields: ['value']
    }],
    range: ['red', 'green'],
  }],
  label: {
    visible: true,
    formatMethod: (text, datum) => {
      return `${datum.type}: ${datum.value}`
    },
    style: {
      fill: {
        scale: 'labelScale',
        field: 'value'
      }
    }
  },
  tooltip: {
    mark: {
      content: [
        {
          key: datum => datum['type'],
          value: datum => datum['value'] + '%'
        }
      ]
    }
  }
};

const vchart = new VChart(spec, { dom: CONTAINER_ID });
vchart.renderSync();

// Just for the convenience of console debugging, DO NOT COPY!
window['vchart'] = vchart;
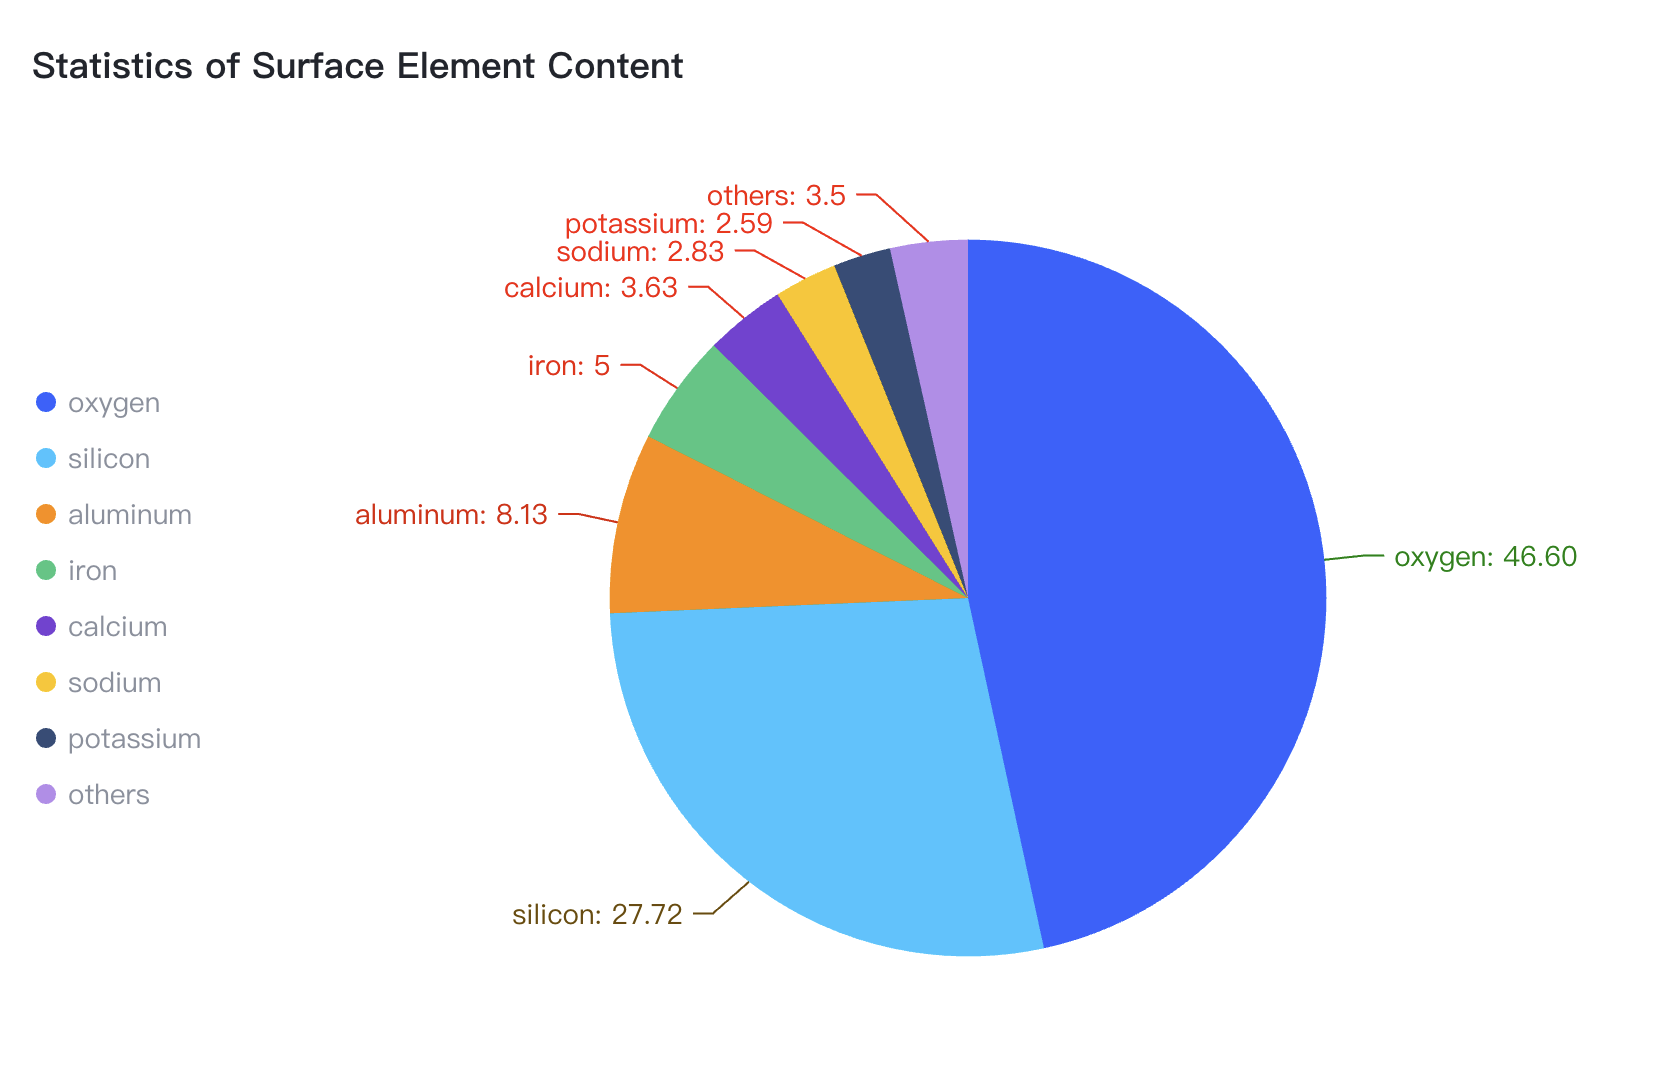
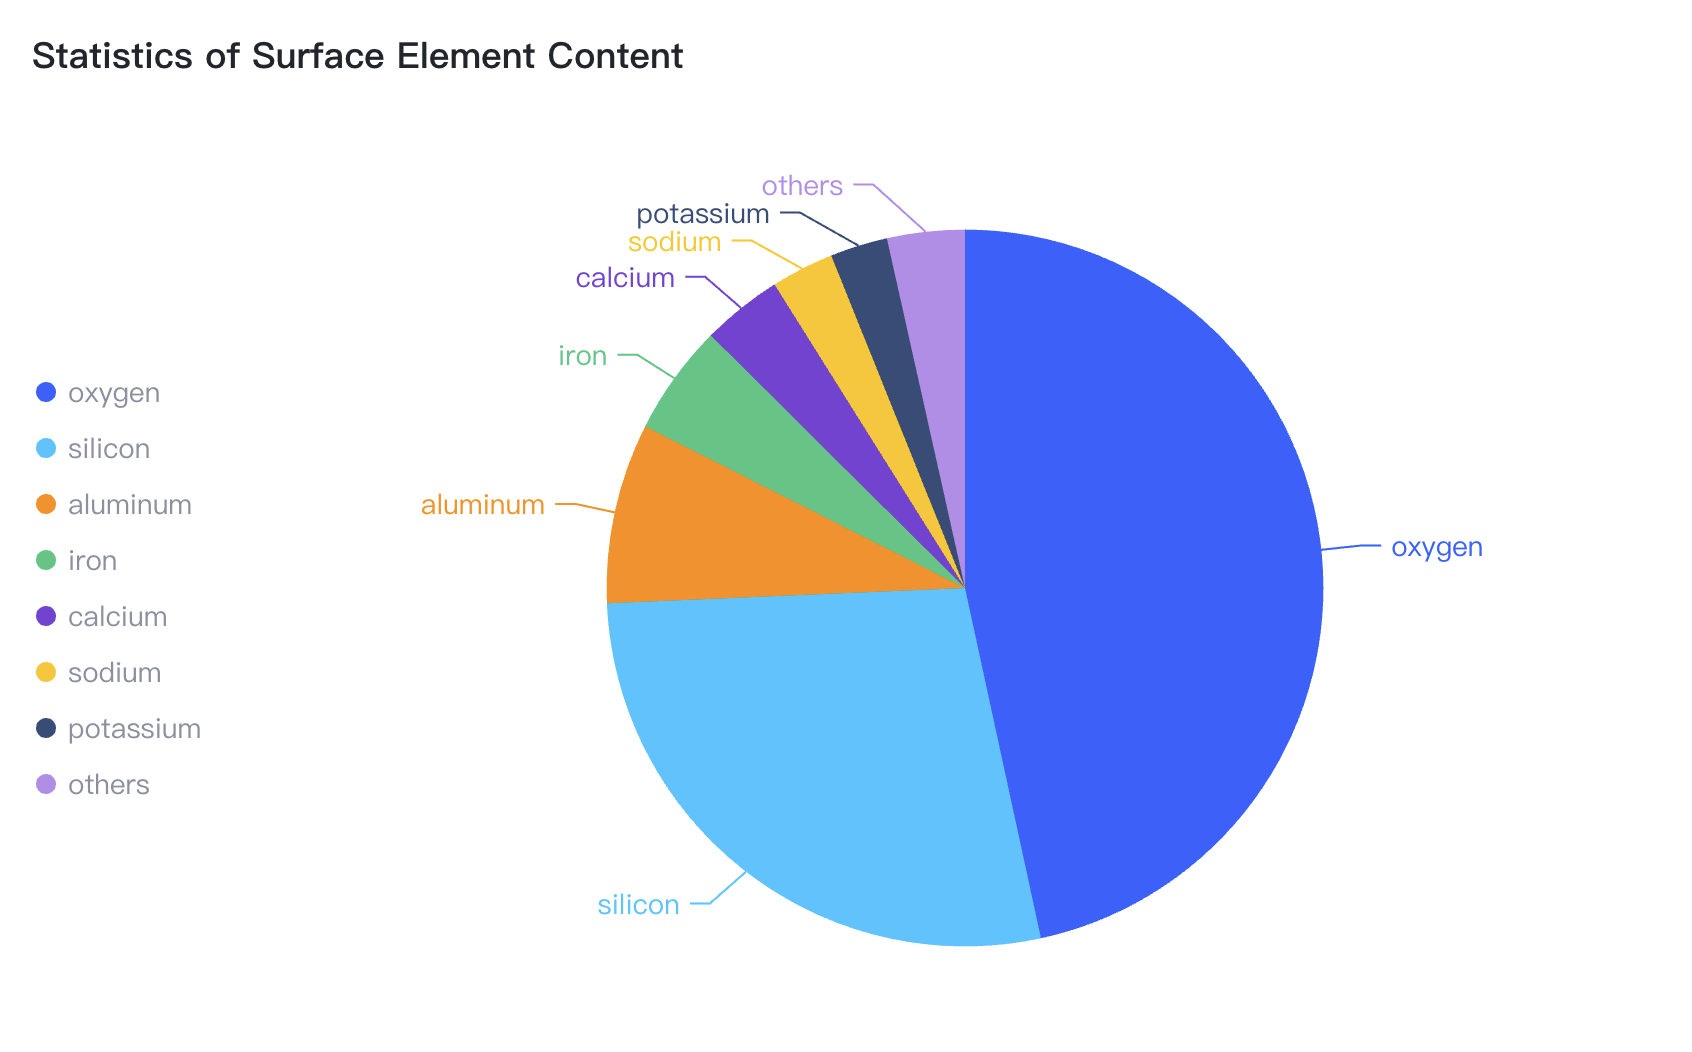
- 自定义布局,将标签设置在饼图内部